Business Process Analytics
1)Introduction
Efficient processes are one of the main components of successful organizations in the 21st century.
As enormous amounts of process related data are stored everywhere, the possibility to analyze and improve processes gave rise to the field called
"process mining".
It is aimed at discovering useful insights from process data.
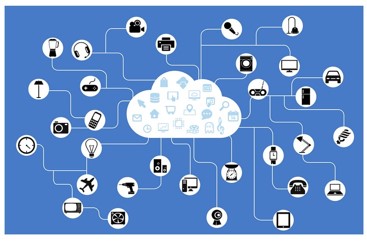
2)Event data
With the emergence of the Internet of Things, a lot of things around us are recording data about events that happen over time.
As a result, the types of event data you can analyze is literally infinite.
In this course you will learn about the different components of event data, and how to
>Create
>Preprocess
>Analyze
the event data.
Event data consists of three basic components:
>the why,
>the what
>and the who.
an event is a recorded action of an activity (the what) occurring for an instance (the why) by a specific resource (the who).
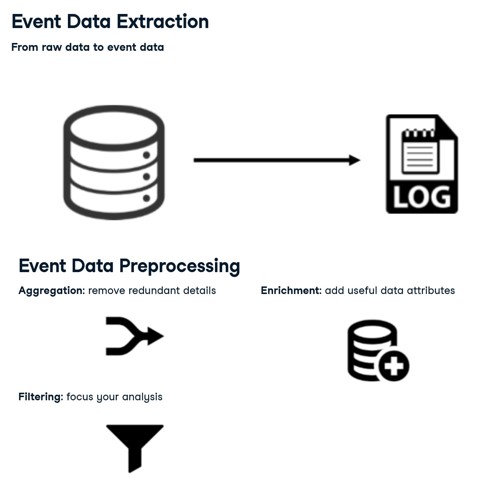
3)Process analysis workflow
Analyzing event data is an iterative process of three steps:
extraction,
processing
and analysis.
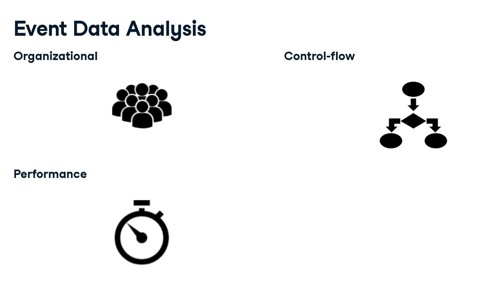
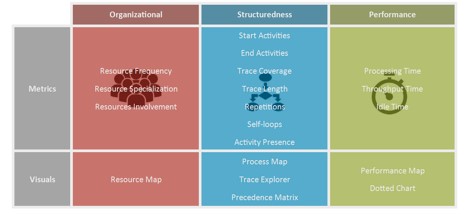
4)Different perspectives after analysis
Three perspectives can be distinguished.
Firstly, the
organizational perspective focuses on the actors.
Secondly, the
control-flow perspective, focusses on the flow and structuredness of the process.
Finally, the
performance perspective, focusses on time and efficiency.
Furthermore, we can also combine different perspectives, for example investigate whether there are links between actors and performance issues.
Additional data attributes which are available, such as the cost of activities or types of customers, can also be included.
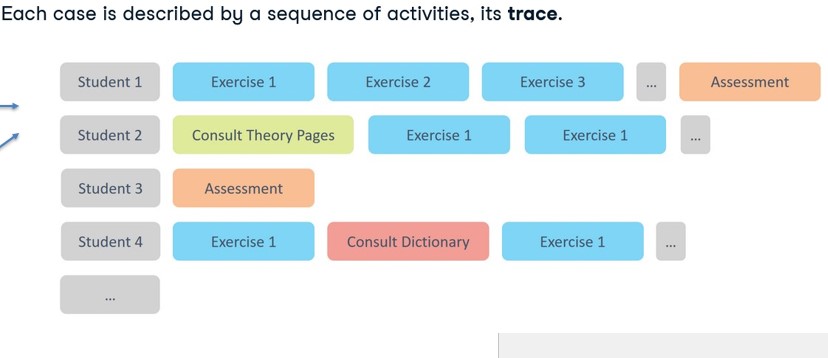
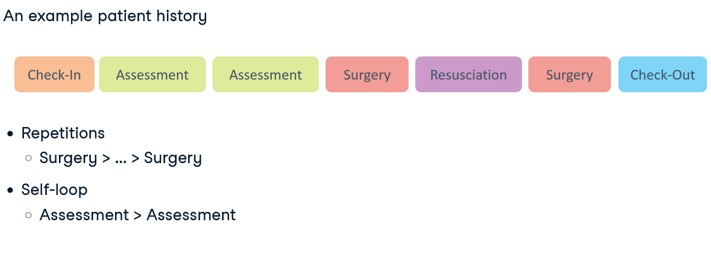
5)Exploring the sequence of activities
The sequence in which the activities occurs is called the trace of the case.
A list of the traces can be retrieved with the `traces` function, or they can be visualized using the `trace_explorer`.
For student 1, we see a very structured path, progressing through the different exercises, and finally doing the assessment.
However, student 2 starts with looking at the theory pages, before doing exercise 1, which he executes two times in a row.
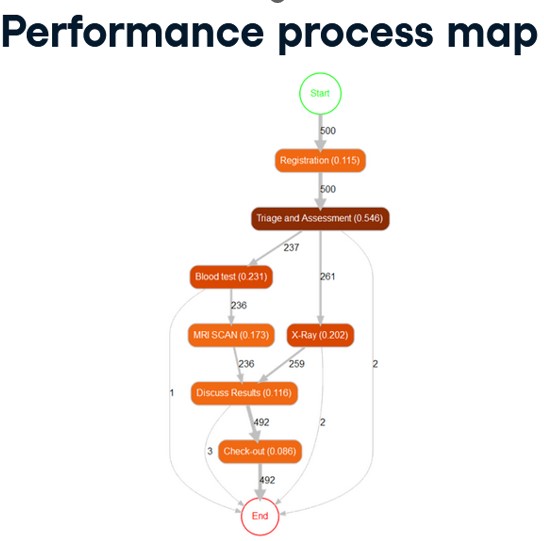
6)Process maps
Another way to visualize processes is by constructing a process map.
A process map is a directed graph that shows the activities of the process and the flows between them.
The colors of the nodes and the thickness of the arrows indicate the most frequent activities and process flows.
7)Different components of process data:
-
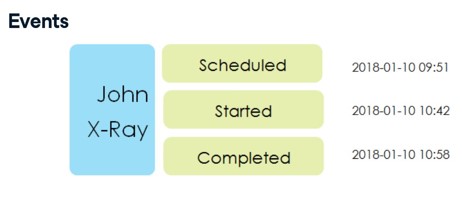
1.Events
If we take a closer look at the X-Ray activity execution for John, we would see that it was scheduled during registration at 9:51.
It actually started at 10:42, and was finished at 10:58. Each of these time recordings is called an event.
-
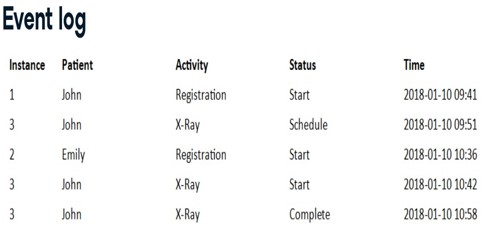
2.Event log
A log book of events is called an event log.
For our current example, the event log looks as shown here.
There are two registration instances, for which only a start event is recorded (the arrival of the patient), and there is 1 X-ray instance which consists of 3 events.
-
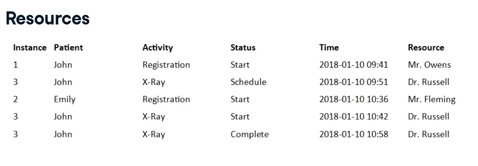
3.Resources
Another component of process data are the resources.
Resources are the actors in the process.
In our example, there are three resources: Mr. Owens and Mr. Fleming who performed the registration of John and Emily, respectively, and Dr. Russell who performed the X-ray.
8)Different perspectives after analysis
- Organizational Analysis
Who executes the work?
In order to know who executes the work, we can take a look at the resource labels, using the resource_labels function.
We can see that there are 12 resources in this example process: doctors, nurses, clercks and an emergency crew.
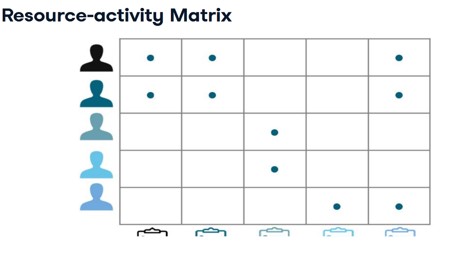
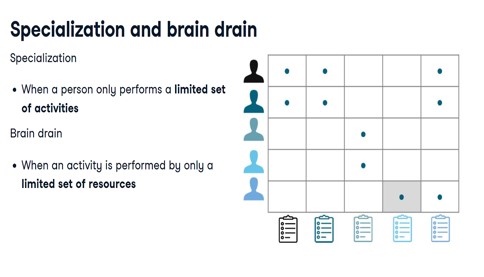
We can also create a resource-activity matrix which shows what resource in your organization performs what task.
Specialization and Brain drain:
When a person performs relatively few activities, we can say that this person is specialized, like person 3 and 4 in this example.
Knowing the specializations of your work-force is very important from a knowledge management perspective: knowing who to go to for a specific issue, or knowing who to enlist for specific trainings.
On the other hand, it can also occur that only one person is in charge of a certain activity, like the forth activity in this example.
This presents an important risk in terms of knowledge retention: if the person leaves the company, you might suffer an important loss of knowledge concerning this step of the process.
- Control-flow analysis
The structuredness of the process.
When we look at structuredness, we often speak of "control-flow".
Control-flow refers to the different successions of activities, like in the example we saw of the different students.
Recall that each case can be expressed as a sequence of activities.
Each unique sequence is called a trace or process variant.
There are several ways to look at the variants of the process.
On one hand, we have several metrics which we can use to look at one specific aspect of the process:
start and end activities,
the distribution of the case length,
which activities are always present in a case and
which are exceptional.
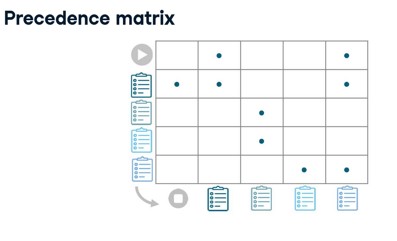
There are various visual tools to look at control-flow patterns:
Process map
Trace explorer
Precedence matrix.
- Performance analysis
9)Linking different perspectives
For each of these aspects, we used process metrics, which return various numeric results, as well as visuals, which return maps of the process as well as other process-specific graphs, like dotted charts.
While each of these aspects is important in its own right, it is also interesting to look at the links between them and between any additional information we have stored in our data.
For example, is there a relation between the actors working on a case, and the order in which the work is done. How is the order in which the work is done related to the efficiency in terms of throughput time? Or are there differences in how different resources plan and execute their work in terms of time schedules?
SOURCE: DATACAMP course on business process analytics with R